

Why web apps get slower over time, and what actually fixes it
Slowness is usually one of three problems, and teams misdiagnose the expensive one. A diagnostic framework for web applications that have quietly decayed.
- Published
- Published 27 April 2026
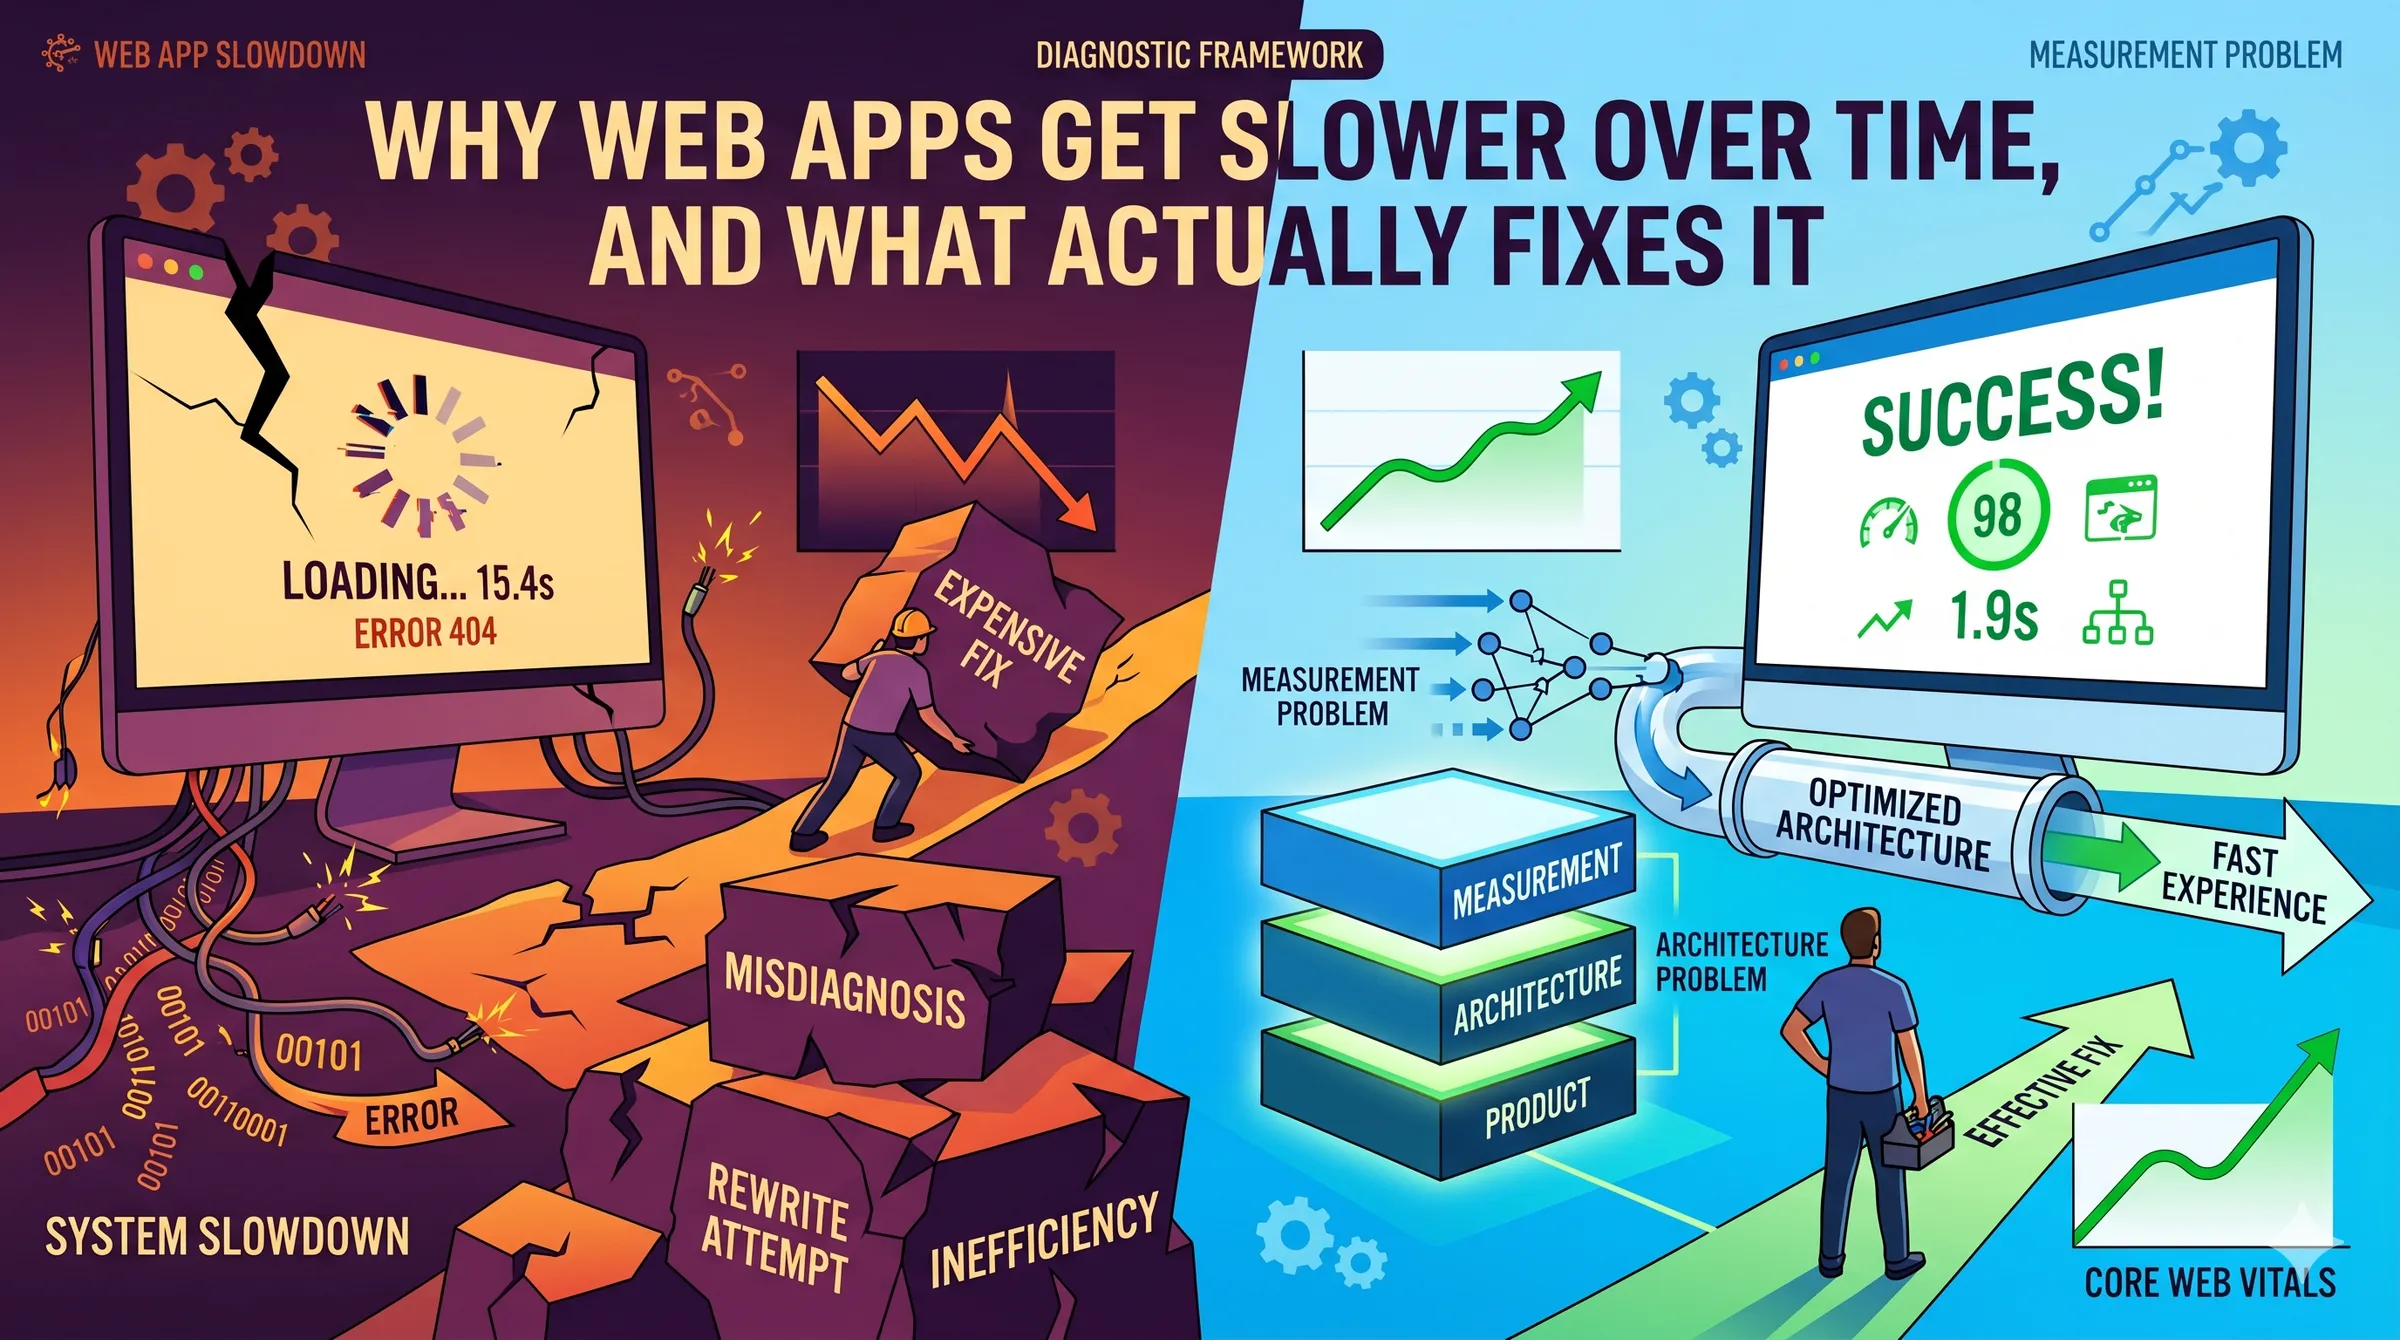
TL;DR. Web apps get slower for three reasons: a measurement problem, an architecture problem, or a product problem. Most teams assume it's architecture and reach for a rewrite. In our experience the honest diagnosis is usually the other two, and they are much cheaper to fix. The order you run the diagnostic matters more than the fixes themselves.
What "slow" actually is, and who's experiencing it
Before anything else, a small definition that saves teams months of wasted work. "Slow" is a claim about what real users experience at the 75th percentile of their real devices on their real networks. It is not what your laptop shows on a gigabit connection, and it is not what Lighthouse reports in a sanitised lab run.
Google's Core Web Vitals are the cleanest public benchmark for this. A page is considered good when, at the 75th percentile of field data, the Largest Contentful Paint is under 2.5 seconds, Interaction to Next Paint is under 200 milliseconds, and Cumulative Layout Shift is under 0.1 (web.dev). INP replaced First Input Delay as the interactivity metric in March 2024, which is worth knowing because it is much harder to pass. Under INP, only 43% of mobile sites passed all three Core Web Vitals in 2024, with LCP the dominant bottleneck at 59% pass rate (HTTP Archive Web Almanac, Performance chapter, 2024).
If you don't have field data, you don't yet know whether your app is slow. That is not a rhetorical point. We regularly meet teams confident their app is fast because it feels fast on their own machines, and whose users are seeing 6-second LCPs on a four-year-old Android. The gap between developer experience and user experience has been widening for a decade, not narrowing. This is the starting line.
Three reasons an app gets slower, and which one you probably have
There are three honest answers to "why is our web app slow." They tend to get diagnosed in the wrong order.
It's a measurement problem. You think the app is slow but you're looking at the wrong data, or you have no field data at all. The app is fine for most users and painful for a specific subset that's invisible on your monitoring stack. Or the lab metric you watch doesn't correlate with what users feel.
It's an architecture problem. The app is genuinely decaying under its own weight. Bundle sizes have crept up. Hydration cost has grown. A third-party tag added two years ago has started dominating the main thread. An index that matched the 2022 query pattern no longer matches the 2025 one. Each individual addition was reasonable. The sum is not.
It's a product problem. You've added features year after year and never retired any. The engineering work is well done. The app is slow because every user now pays the cost of features most of them never use. Pendo's analysis of SaaS products found that roughly 80% of features are rarely or never used, and about 12% of features drive 80% of daily usage (Pendo Feature Adoption Report — note that Pendo sells product analytics, so read the number as directional, but the shape is consistent across every serious study we've seen). Slowness in this case is a scope problem wearing an engineering disguise.
The expensive mistake is to assume it is always the second one.
Is it a measurement problem?
Start here, always. The three questions that resolve this lane:
Do you have field data for your actual users? Chrome User Experience Report (CrUX) data is free and published publicly for any site with enough traffic. Your own analytics tool may include it, or you can pull it directly. If you're navigating only by Lighthouse runs from a CI pipeline, you're reading the wrong map.
Is the slow experience evenly distributed, or concentrated? P50 and P75 tell different stories than a mean. A site can have healthy averages and a long tail of users on low-end Android devices on degraded networks who are having a dramatically worse experience. The median company's mobile page weight has grown from 505 KB in 2014 to 2,311 KB in 2024, a 357% increase, and a lot of that weight is paid for disproportionately by the slowest devices (HTTP Archive Web Almanac, Page Weight, 2024).
Are you testing on hardware that represents your users? Alex Russell's 2024 analysis of the performance inequality gap notes that a mid-range Android like the Samsung A51 runs JavaScript at roughly 15% to 25% the speed of a developer laptop. A reasonable 2024 budget for hitting 3-second time-to-interactive on that hardware is about 365 KB of compressed JavaScript (Infrequently Noted, 2024). The median mobile JavaScript payload is now 558 KB (HTTP Archive, 2024). Most apps are over budget for hardware they never test on.
If any of these comes back uncomfortable, the first fix is to get honest field data and a test device that resembles a user's. That is often where the story ends.
Is it an architecture problem?
If measurement is clean and the app is genuinely slow for real users, the architecture lane is where most engineering hours get spent. The decay pattern is almost always accumulation rather than a single bad decision. A short catalogue of what we see repeatedly:
Third-party tag sprawl. Analytics, session replay, chat widget, A/B tester, marketing pixel, and customer data platform each added by a different team at a different time, none ever removed. By year four, third-party scripts can dominate main-thread work even when first-party code is fine. 92% of pages now use at least one third-party resource (HTTP Archive, Third Parties, 2024).
Hydration debt in single-page apps. Every new feature adds event handlers and state to the client bundle. The page renders fast but stays non-interactive longer. INP regresses quietly because FID only measured the first interaction and hid the problem until March 2024. Teams often discover this the week they first look at INP field data.
Bundle splitting that fossilised. The route-level code split set up three years ago still technically works. It just doesn't split anything anymore, because new shared imports have pulled everything into the common chunk. The config looks healthy in CI; the output isn't.
Dead features still paying the cost. The report builder nobody uses still ships its 80 KB chart library to every page because the route import graph was never pruned. Feature removal that isn't matched with bundle pruning leaves ghost weight behind.
Database and ORM drift. Indexes designed for 2022 query shapes silently stop matching 2025 query shapes. An ORM helper adds a relationship accessor on a list view and 200 list items become 201 queries. Neither errors. Both show up as a slow creep in p95 latency, months after they were introduced.
Framework upgrades that didn't deliver. The codebase moved to streaming SSR, but one legacy data-fetching layer still blocks the stream. The new architecture exists on paper. The benefits haven't landed because the blocking dependency is still there.
Architecture fixes are the most expensive category, not because individual changes are hard but because they require sustained attention across a quarter or more.
Is it a product problem?
This is the lane almost no one names, and it's often the cheapest lever available.
Ask, honestly, which parts of the app your users actually use. If the Pendo number is even half right at your company, you have a set of features that consume engineering and runtime cost out of proportion to the value they deliver. Shipping the chart library to every user when 6% of users open the charts page is not a performance strategy. It's a scope decision that the performance team inherited.
Product triage for performance looks different from product triage for roadmap prioritisation. You're asking a narrower question: for each feature, what is its cost to load and interact, and what fraction of users ever see that cost recouped? Features that never recoup their cost are candidates to lazy-load, move behind an import boundary, or retire.
The signal that this is your real problem is usually this: the engineering team has already done a lot of careful performance work, individual fixes have landed, and the overall metric hasn't moved much. That is what a product-weight ceiling feels like. You cannot optimise your way out of a scope problem.
The order the diagnostic runs
This is the part that matters most.
- Measurement first. Cheapest by a wide margin. Often ends the story.
- Product second. If measurement is clean and the app is truly slow, ask what fraction of the shipped weight is paying for features anyone uses. Feature triage is cheaper than architecture work and more reversible.
- Architecture third. Only after the first two has been run honestly. The work is real and worth doing, but it is the expensive last resort, not the first reach.
The expensive pattern we see repeatedly is teams jumping directly to step three. A six-month architectural initiative lands, individual metrics improve, and the app is still slow at p75 because the underlying scope problem was never touched. This is how teams end up planning a second rewrite.
For the closely related decision of when custom work is the right call at all, see our earlier piece on build vs. buy vs. integrate. The same instinct that over-reaches for "let's build it ourselves" over-reaches for "let's rewrite it."
When a rewrite is the right answer
Rewrites can work. When they do, they tend to share three traits.
They start from measured evidence. Pinterest's mobile web rebuild in 2017 was scoped to three months, not three years, and was preceded by field data showing mobile web was dramatically worse than desktop on core conversion. The result was documented publicly: a 60% lift in core engagement and a 40% lift in time spent. The work was focused because the measurement was honest.
They are incremental rather than total. Wix's runtime rewrite was documented by web.dev as tripling their Core Web Vitals pass rate year-over-year, delivered through staged improvements rather than a big-bang rewrite.
They avoid the Netscape pattern. Joel Spolsky's Things You Should Never Do, Part I is twenty-five years old and still the best argument against throwing away working software. Netscape's 4-to-6 rewrite took three years, shipped late, and handed the market to Internet Explorer. The lesson isn't "never rewrite." It's that the confidence of "we know why this is slow, and the fix is a ground-up rewrite" is almost always wrong. The rewrites that succeed are the ones that started smaller than the team wanted.
The honest read is that successful rewrites publish, failed rewrites quietly get relabelled as "v2 is taking longer than expected." The base rate for rewrite success is not as good as the engineering blog posts make it look.
What actually fixes it
The short version, in the order you should attempt it:
- Get real user field data. Look at CrUX, at your own RUM tool, at p75 not mean, and at the 25% of users on the slowest hardware.
- Buy or borrow a test device that resembles a typical user, not a developer laptop. A mid-range Android from two to three years ago is a reasonable proxy.
- Audit third-party scripts. Every tag, every pixel, every widget. Keep what earns its weight.
- Audit feature usage. Every route, every bundle. Retire or lazy-load features that consume weight disproportionate to their use.
- Measure before and after each change. If a change doesn't move a field metric, it didn't help users.
- If measurement is clean, third-parties are disciplined, and the product is scoped, then and only then do you start structural architecture work. Treat rewrites like surgery, not like house-cleaning.
Most apps that feel slow in 2026 can be materially faster without a rewrite. The teams that commit to the diagnostic in order usually discover that the expensive option was unnecessary. The teams that skip it tend to discover the same thing, just six months and a seven-figure project later.
Frequently asked questions
What are the current Core Web Vitals thresholds?
A page is considered good when, at the 75th percentile of real-user data, Largest Contentful Paint is under 2.5 seconds, Interaction to Next Paint is under 200 milliseconds, and Cumulative Layout Shift is under 0.1. INP replaced First Input Delay as the interactivity metric in March 2024 and is substantially harder to pass. Google documents current thresholds on web.dev.
Why did our app suddenly get worse on Core Web Vitals in 2024?
Most likely because INP replaced FID as the Core Web Vitals interactivity metric on 12 March 2024. FID only measured the first interaction on a page, which hid most real-world responsiveness problems. INP measures ongoing interaction latency and is a much more honest metric. In 2024, only 74% of mobile sites passed INP, compared to 79% under CLS and 59% under LCP (HTTP Archive Web Almanac, 2024). Many apps that were passing Core Web Vitals in 2023 quietly started failing in 2024 without any code change.
Is a rewrite usually the answer to a slow web app?
Usually no. Rewrites are the most expensive intervention available, and the base rate of success is weaker than engineering blog posts imply. Disciplined, measured rewrites like Pinterest's 2017 mobile rebuild and Wix's runtime rewrite do work, but they share three traits: they are preceded by honest field data, tightly scoped, and delivered incrementally. Most performance problems in long-lived apps can be resolved by measurement discipline, third-party audits, and feature triage before architectural work is needed.
How much JavaScript is too much on a mobile web app?
Addy Osmani's widely-cited mobile performance budget is around 170 KB of compressed JavaScript to give median users a reasonable experience. Alex Russell's stricter 2024 analysis puts the ceiling for a 3-second time-to-interactive on a mid-range Android at around 365 KB compressed. The median mobile JavaScript payload in 2024 was 558 KB per HTTP Archive. Most production apps are over budget for the hardware their users actually have.
How do we know if performance problems are architectural or product-driven?
Run the diagnostic in order. If measurement is honest and clean, and individual engineering fixes have landed but overall field metrics haven't moved, the problem is almost certainly product scope rather than architecture. A useful test: for each major feature, estimate what fraction of users ever uses it, and what fraction of load weight it costs every user. If a feature used by fewer than 10% of users contributes more than 5% of page weight, you have a product problem, not an architecture problem.
Inherited a slow app and not sure where to start? Get in touch for an honest read. For more on how we approach work like this, see our process, web applications, and support and maintenance.
Written by the DevLume team. We work with growing teams on the software they've already shipped, not just the software they're about to build.